Data Sharing via Dashboards
Securely share your dashboards with real-time data, allowing other users to view your insights directly.
Intuitive Dashboard Builder
Create visually compelling dashboards with an easy drag-and-drop interface—no technical skills required.
Shareable Dashboard Templates
Enable seamless collaboration by sharing customizable dashboard templates with other users. Recipients can apply these templates to their own data sources, creating consistent and visually stunning insights across teams or organizations.
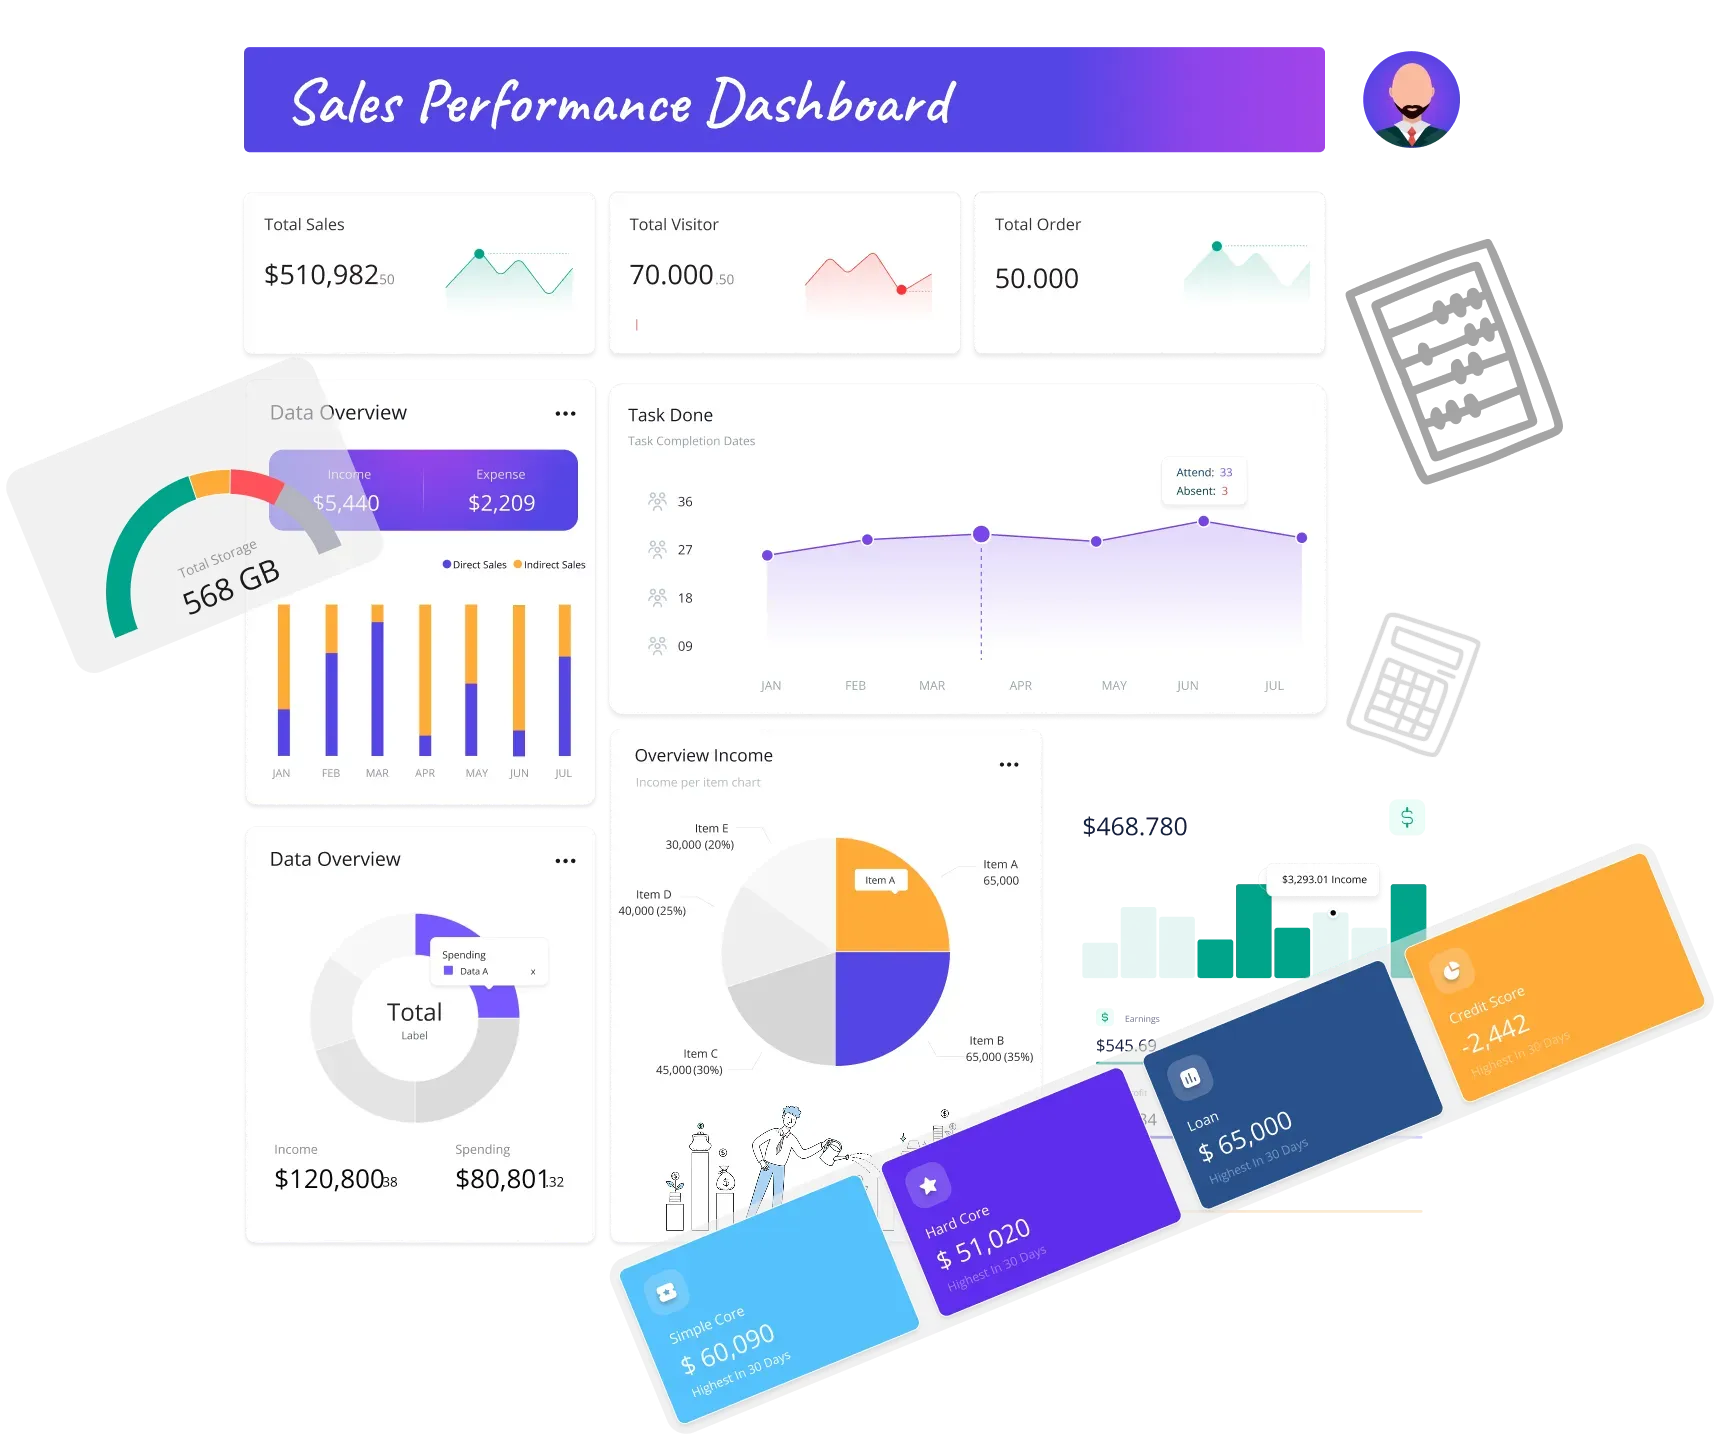
Interactive Data Visualizations
Turn complex data into stunning charts, graphs, and tables for clear and actionable insights.
Advanced Report Builder
Design detailed, multi-page reports with full customization options for headers, layouts, and visuals.
Data Drill-Down
Dive deeper into your data by clicking on any metric to uncover trends and root causes.
Cross-Platform Access
Access dashboards and reports on desktop, tablet, or mobile, ensuring insights are always within reach.
Scheduled Report Distribution
Automate the delivery of reports to teams or stakeholders via email or shared links.
Custom KPIs and Metrics
Define and track your organization’s unique KPIs directly on your dashboards.
Role-Based Access Control
Secure sensitive data with permissions that restrict access based on roles or departments.
Multi-Dimensional Analysis
Slice and dice data by geography, time, category, or custom dimensions for deeper insights.
Real-Time Collaboration
Share dashboards and reports with your team, enabling collaboration and joint decision-making.
Data Made Fun and Flexible
Our BI tool is incredibly user-friendly, allowing you to customize anything you want. You can add images, change colors, and choose from various charts, with such ease that it feels like you’re playing a game!
Historical Data Analysis
Compare current metrics against historical data to spot trends and measure growth.
White-Labeling Options
Brand dashboards and reports with your company’s logo and colors for a professional look.
Data Export in Multiple Formats
Export reports in PDF, Excel, or PowerPoint formats to share insights across platforms.