View Projects Repository
Introduction:
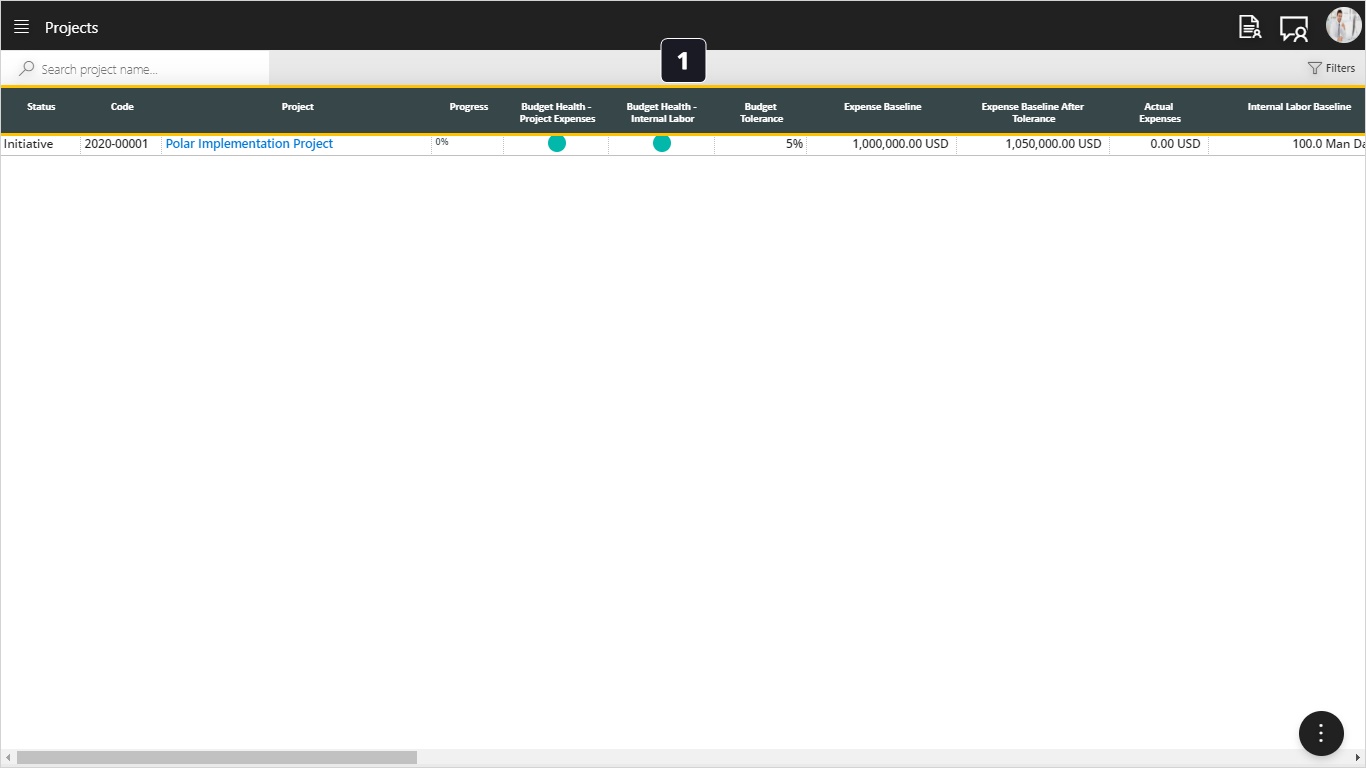
This is your Projects List that includes the whole projects data. It is a flexible grid as you can drag and drop any column to reorder it based on your preferences and it will be a personalized view for your specific use as a user only.
Steps:
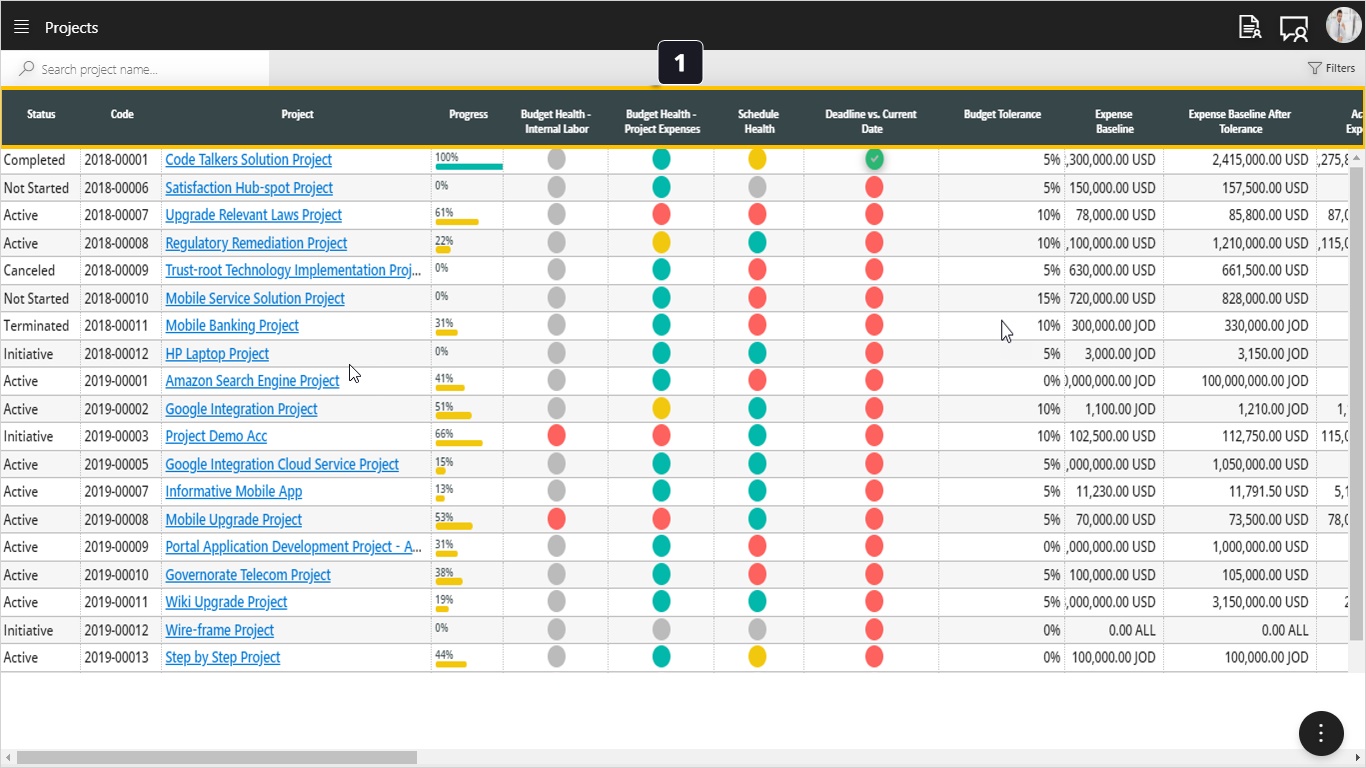
Tip: We have inserted 2 pictures, first one is the view that we will see when we have one project only in our projects repository and it has not started yet, second one is when you have multiple projects with different status and progress.
- Once you land on projects repository screen, you will see the projects grid, to know more about its columns, review below:
- Status: This column will show you the status of the project (Initiative, Not Started, Active, Paused, Terminated, Canceled, & Completed)
- Code: This column will show you the project code which will be generated automatically. It is un-editable.
- Project: This Column will show you the project name, just click to drill down inside the project.
- Progress: This column will reflect the percent completion of the project as calculated from the project schedule.
- Budget Health – Internal Labor: This column will show you the RAG (Red, Amber, and Green) based on the baselined internal labor budget:
- Red: means that the actual internal labor recorded from the time sheets is more than the approved baselined internal labor.
- Amber: means that if the internal labor project baseline had tolerance (acceptable variance) so the actual internal labor recorded from the time sheets is still within the acceptable variance but in risky mode.
- Green: means that the actual internal labor recorded from the time sheets is less than the approved baselined internal labor.
- Gray: this color indicates that the project manager did not set internal labor baseline yet.
- Budget Health – Project Expenses: This column will show you the RAG (Red, Amber, and Green) based on the baselined project expense budget:
- Red: means that the actual expenses recorded from the project finance is more than the approved baselined project expense.
- Amber: means that if the project expense baseline had tolerance (acceptable variance) so the actual expenses recorded from the project finance is still within the acceptable variance but in risky mode.
- Green: means that the actual expenses recorded from the project finance is less than the approved baselined project expense.
- Gray: this color indicates that the project manager did not set project expense baseline yet.
- Schedule Health: This column will show you the RAG (Red, Amber, and Green) based on the baselined project schedule:
- Red: means that the current schedule finish date exceeds the baseline schedule finish date so we have delays.
- Amber: means that if the project schedule baseline had tolerance (acceptable variance) so the current schedule finish date is still within the acceptable variance but in risky mode.
- Green: means that the current schedule finish date does not exceed the baseline schedule finish date so we are ahead.
- Gray: this color indicates that the project manager did not set project schedule baseline yet.
- Deadline Vs. Current Date: This column will show you the RAG (Red, Amber, and Green) through comparing the Project Schedule Baseline with the current date (As of Today).
- Budget Tolerance: This column shows the percentage of the accepted variance over the baseline budget either internal labor or project expense.
- Expense Baseline: This column will show you the approved expense baseline for the project
- Expense Baseline after Tolerance: This column will show the approved baseline after adding to it the tolerance (Acceptable Variance).
- Actual Expenses: This column will show the actual expenses that were paid to continue working on this project. These columns calculate its value from the added invoices in project finance.
- Internal Labor Baseline: This column will show you the approved Internal Labor Baseline for the project
- Internal Labor Baseline after Tolerance: This column will show the approved baseline after adding to it the tolerance (Acceptable Variance).
- Actual Internal Labor: This column will show the actual labor time that was spent to complete work on this project. This column calculates its value from the approved timesheets.
- Baseline Start: This column will show you the approved start Baseline for the project
- Baseline Finish: This column will show you the approved Finish Baseline for the project
- Baseline Finish Tolerance: This column shows the percentage of the accepted delay or variance.
- Baseline Finish after Tolerance: This column will show you the approved Finish Baseline for the project with the tolerance (Acceptable Variance).
- Start: This column will show the start date based on current project schedule
- Finish: This column will show the finish date based on current project schedule.
- Project Manager: this column will show the name of the project manager
- Sponsor: this column will show the name of the project sponsor
- Portfolio: This column will show the portfolio linked to this project.
- Business owner: This column will show the Business owner linked to this project.
- Strategic Driver: This column will show the Strategic Driver linked to this project.
- Category: This column will show the project Category linked to this project.
- Sub-Category: This column will show the project Sub-Category linked to this project.